|
Educational information only, the same for every reader: it describes market indicators and how they have behaved, and is not investment advice or a recommendation to buy or sell anything. Backtested results are hypothetical; past results do not guarantee future results.
| | DIVERGENCE Diverging 0 of 5 confirming SPY is near its highs, but 5 of 5 breadth families are not confirming. The monitor → |
|
|
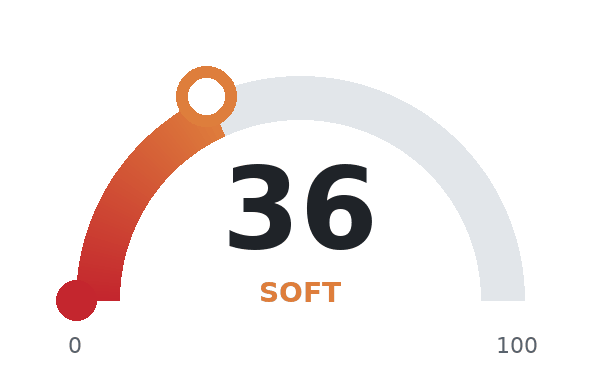
What the data is telling us Breadth is softening: more indicators are weakening than strengthening. The index is near its highs while participation narrows: 5 of 5 breadth families are not confirming, a pattern that has come before several tops and also many times when nothing followed. Some early warning signs of a top are present, but they do not yet agree. These readings describe conditions, not a forecast. |
This week
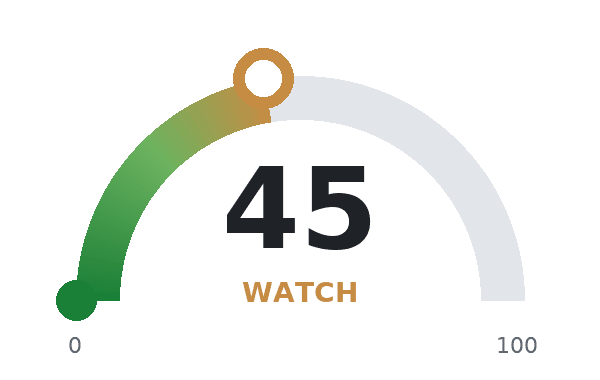
SPY fell 2.0% this week. In the health score, 0 indicators are bullish, 8 neutral and 3 bearish. Market top risk fell 32 points, to 45 (watch). SPY made no new 63-day high this week. A breadth divergence watch is on.
Indicators that changed
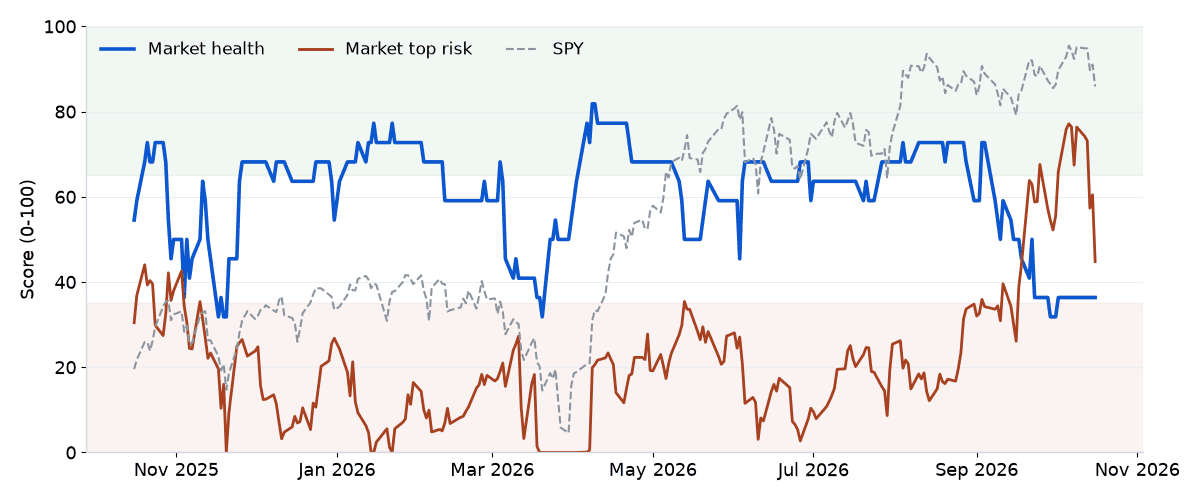
The past year: market health (blue), top risk (rust) and SPY (dashed). Above 65, most health indicators are bullish; below 35, most are bearish.
Every indicator
 | THE BOOK Protect what you have built before the next crash How to Hedge Your Portfolio: Protect Your Wealth and Reduce Risk During Market Crashes. A 50% loss takes a 100% gain to recover. This guide shows long-term investors how to protect a portfolio before a downturn, not after it. - When to hedge, and how to size it and keep the cost down
- Protective puts, collars and inverse ETFs, step by step
- How to stop panic from making the decisions in a crash
- Case studies from past market crashes, in 31 chapters
Written for index-fund, 401(k) and ETF investors, and for retirees and those close to retiring. Kindle edition. By the author of Bear Rhythm, who earns royalties from its sales. |
 | FROM THE SAME AUTHOR: BULL RHYTHM Momentum strategies, tracked live every trading day Eight model stock portfolios built on 12-1 momentum, one of the most researched return factors in finance, run by fixed rules and measured against the S&P 500. - Every holding and every trade published, with the reason in plain words
- The live record since go-live, next to a backtest since 2017
- The Bull Rhythm Weekly by email every Friday
|
Educational information only, the same for every reader: it describes market indicators and how they have behaved, and is not investment advice or a recommendation to buy or sell anything. Backtested results are hypothetical; past results do not guarantee future results. Full disclaimer: https://bearrhythm.com/disclaimer.html
|